Über mich
Kontakt
Musik
Reisen/Ferien
Ausgehen
Street Parade
Lake Parade
Elektronik
Computer
Grafik
Spass
Links
Diverses
Gästebuch
| Matlab Übung: Belastetes Potentiometer |
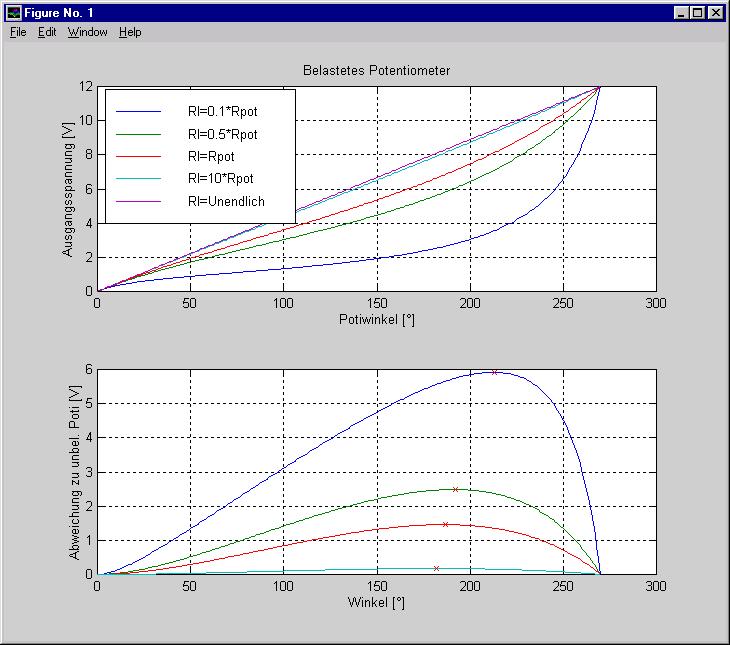
In der Aufgabenstellung geht es darum, die Ausgangskennlinien eines mit verschieden hohen Widerstandswerten belasteten Potentiometers aufzuzeichnen.
Meine Lösung dazu sieht folgendermassen aus:
% Belasteter SpannungsteilerDas Script erstellt die folgende Grafik (Die Legende lässt sich mit der Maus frei verschieben):
% Johann Gysin
% 21.03.2000
% Variabeln
Ubat = 12; % Speisespannung [V]
Rpot = 100; % Widerstand [Ohm] des Potis
Rlast0 = .1; % Lastwiderstand als Faktor zum Potiwiderstand
Rlast1 = .5; % Lastwiderstand als Faktor zum Potiwiderstand
Rlast2 = 1; % Lastwiderstand als Faktor zum Potiwiderstand
Rlast3 = 10; % Lastwiderstand als Faktor zum Potiwiderstand
Rlast4 = inf; % Lastwiderstand als Faktor zum Potiwiderstand
Winkel_min = 0; % Minimal einstellbarer Winkel des Potis
Winkel_max = 270; % Maximal einstellbarer Winkel des Potis
Winkel_ras = 1; % Raster des Potis
% Formeln & Berechnungen
Winkel = Winkel_min:Winkel_ras:Winkel_max;
Rv = (Rpot.*(Winkel_max-Winkel))./Winkel_max; % Rv berechnen
% Ra Parallel Rlast
Ra_par_Rl0 = 1 ./ ( (Winkel_max ./(Rpot .* Winkel)) + (1 / (Rpot*Rlast0)));
Ra_par_Rl1 = 1 ./ ( (Winkel_max ./(Rpot .* Winkel)) + (1 / (Rpot*Rlast1)));
Ra_par_Rl2 = 1 ./ ( (Winkel_max ./(Rpot .* Winkel)) + (1 / (Rpot*Rlast2)));
Ra_par_Rl3 = 1 ./ ( (Winkel_max ./(Rpot .* Winkel)) + (1 / (Rpot*Rlast3)));
Ra_par_Rl4 = 1 ./ ( (Winkel_max ./(Rpot .* Winkel)) + (1 / (Rpot*Rlast4)));
% Ua ausrechnen
Uaa = (Ubat.*Ra_par_Rl0) ./ (Rv+Ra_par_Rl0);
Uab = (Ubat.*Ra_par_Rl1) ./ (Rv+Ra_par_Rl1);
Uac = (Ubat.*Ra_par_Rl2) ./ (Rv+Ra_par_Rl2);
Uad = (Ubat.*Ra_par_Rl3) ./ (Rv+Ra_par_Rl3);
Uae = (Ubat.*Ra_par_Rl4) ./ (Rv+Ra_par_Rl4);
% Abweichungen vom unbelasteten zum Poti
abw1 = (Uae-Uad);
abw2 = (Uae-Uac);
abw3 = (Uae-Uab);
abw4 = (Uae-Uaa);
% Maximale Stellen suchen
[max_abw1, Indiz1] = max(abw1);
[max_abw2, Indiz2] = max(abw2);
[max_abw3, Indiz3] = max(abw3);
[max_abw4, Indiz4] = max(abw4);
% Erste Grafik erstellen
clf; % Grafikfenster löschen
subplot(2,1,1);
plot (Winkel, Uaa, Winkel, Uab, Winkel, Uac, Winkel, Uad, Winkel, Uae);
grid;
legend('Rl=0.1*Rpot','Rl=0.5*Rpot','Rl=Rpot','Rl=10*Rpot','Rl=Unendlich');
xlabel('Potiwinkel [°]');
ylabel('Ausgangsspannung [V]');
title('Belastetes Potentiometer');
% Zweite Grafik erstellen
subplot(2,1,2);
plot (Winkel, abw4, Winkel, abw3, Winkel, abw2, Winkel, abw1, Indiz1, max_abw1, 'rx', Indiz2, max_abw2, 'rx', Indiz3, max_abw3, 'rx', Indiz4, max_abw4, 'rx');
grid;
xlabel('Winkel [°]');
ylabel('Abweichung zu unbel. Poti [V]');
